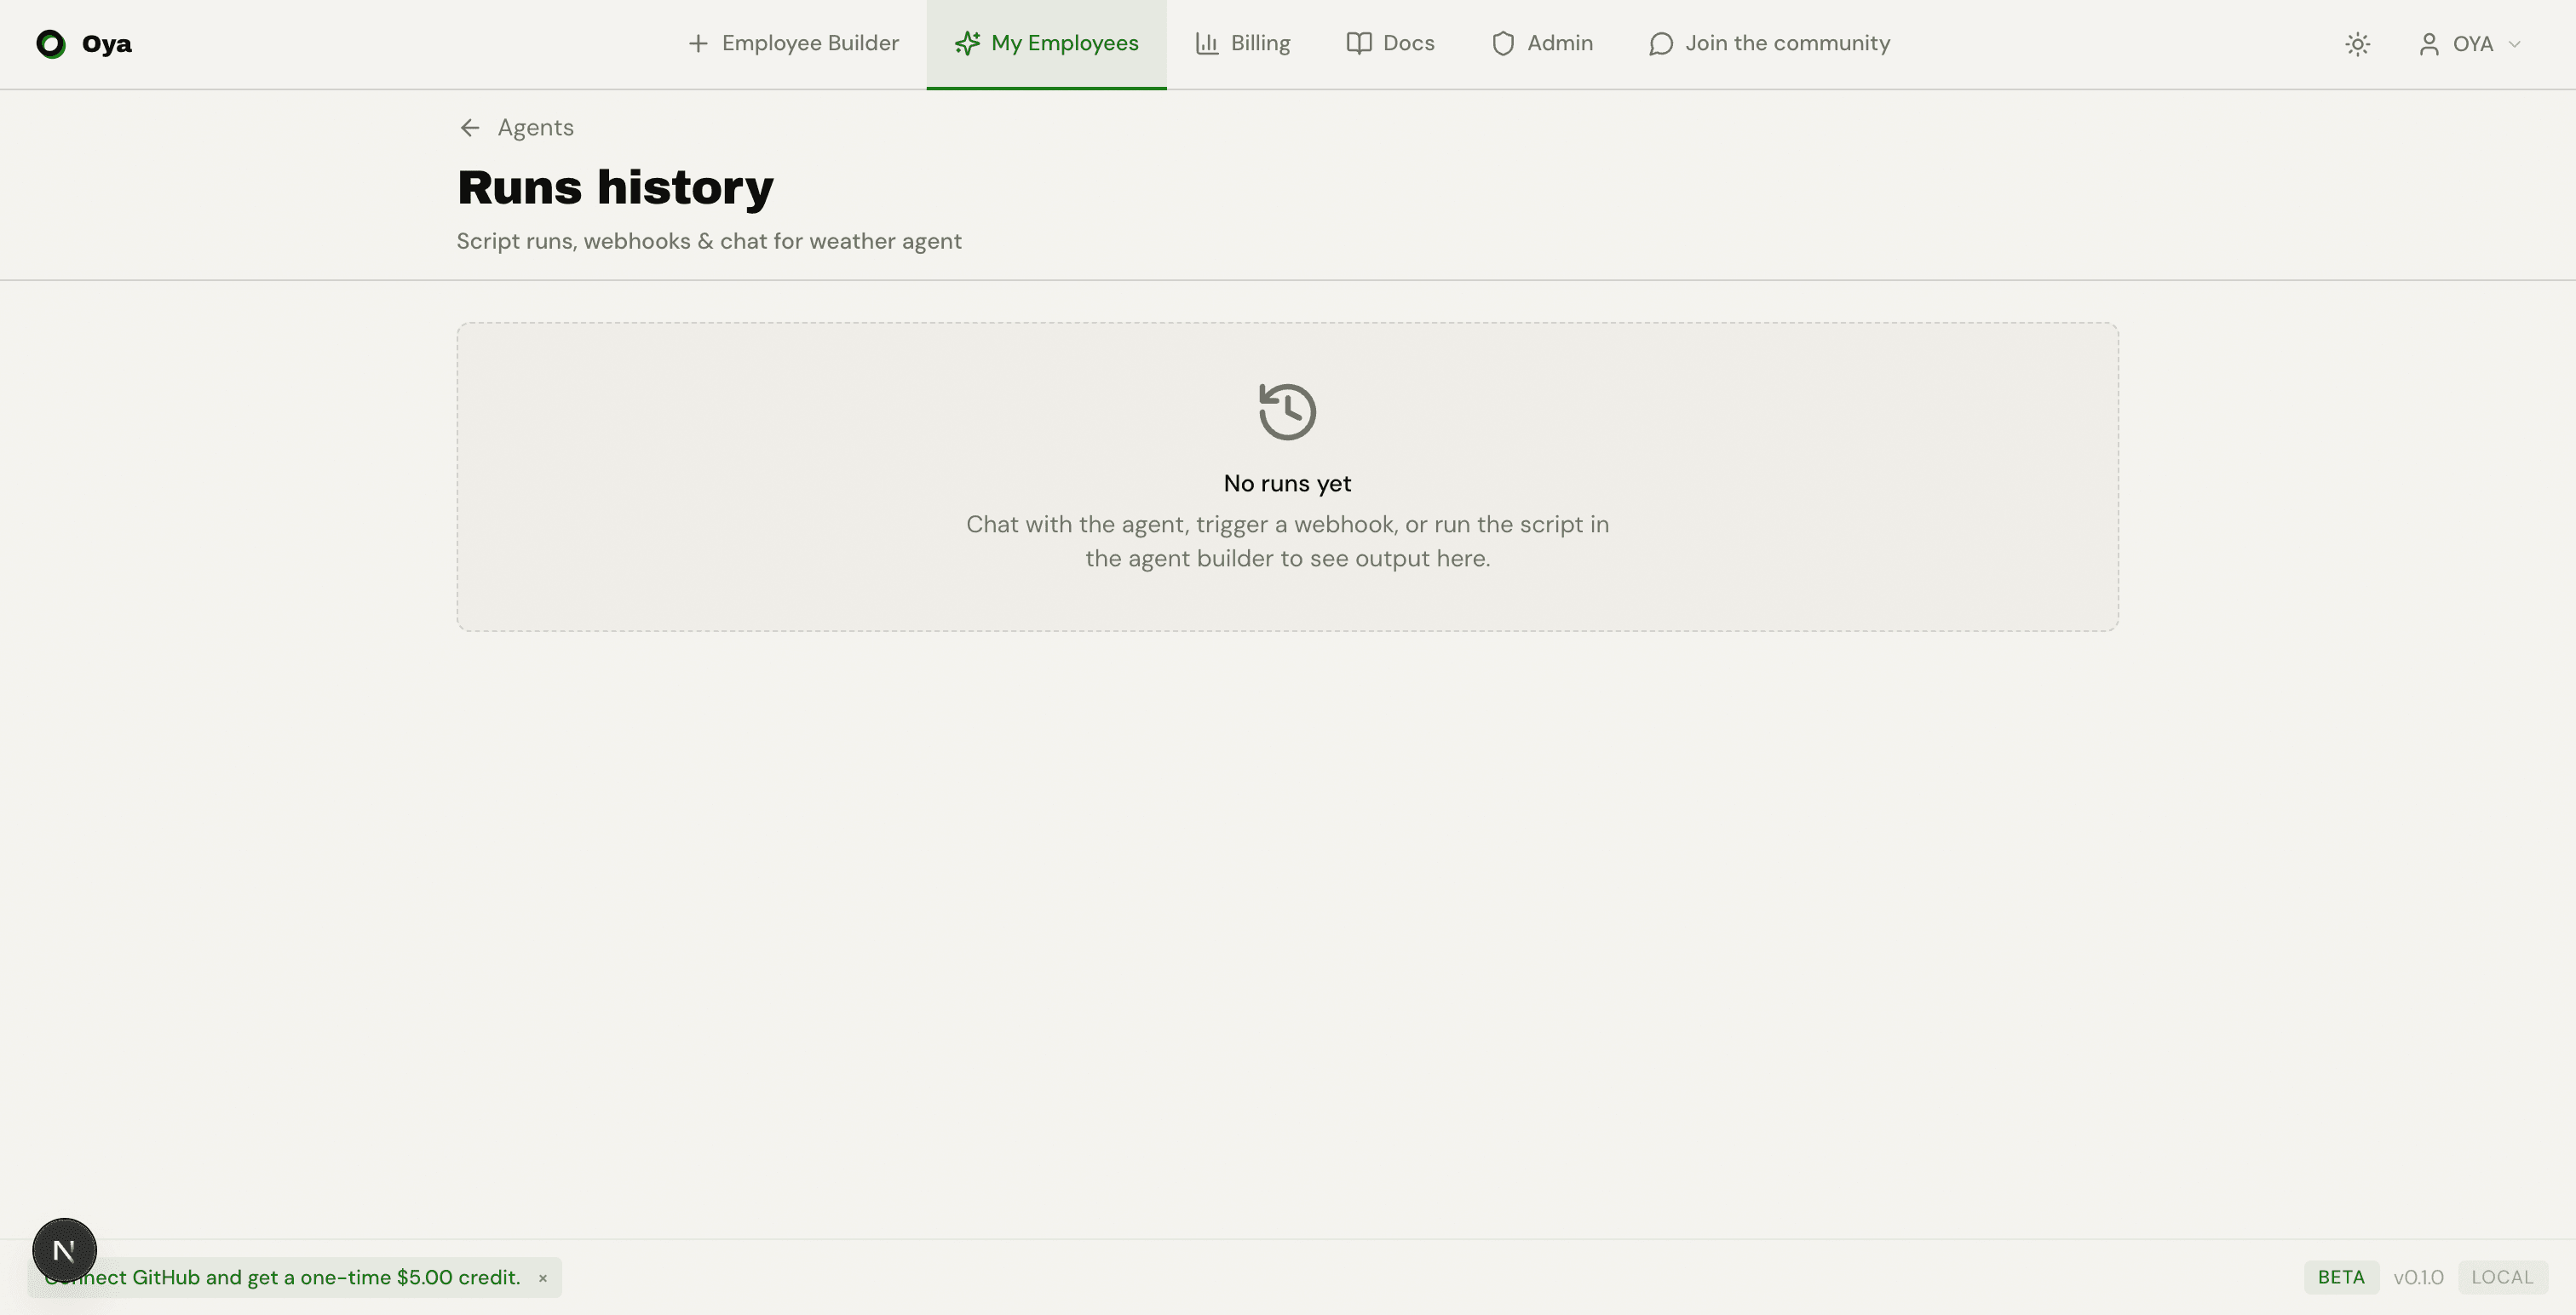
Run History
Browse every run your agent has executed. View inputs, outputs, source, status, and timing for each execution.
Overview
Every time your agent processes a message — from chat, a gateway, or a webhook — it creates a run. The Runs page gives you a complete audit trail of what went in, what came out, and whether it succeeded, making it essential for debugging and monitoring production agents.
Access it at /agents/{agentId}/runs via the Runs link on any agent card.
Run Cards
Each run is displayed as an expandable card showing:
- Source — Where the run originated (Chat, Gateway, Webhook)
- Status indicator — Green dot for success, red dot for error
- Timestamp — When the run executed
- Input — The message or payload that triggered the run
- Output — The agent's response
Click a card to expand it and see the full input and output. JSON payloads are automatically formatted for readability.
Filtering
The filter bar at the top lets you narrow runs by source and status:
- Source filter — All / Chat / Gateway / Webhook
- Status filter — All / Success / Error
- Search — Full-text search across input and output content
Status Indicators
Each run card shows a colored status dot:
- Green dot — The run completed successfully
- Red dot — The run encountered an error
Error runs include the error message in the expanded output, helping you diagnose issues without switching to logs.